Core volume
rCBF <30% · Approx. 95% CI 0.939–0.959

CT PERFUSION · HIGH AGREEMENT WITH RAPID
See the core. Explore the perfusion deficit.
Bring every map into focus with ystia.
Agreement with RAPID · 241 QC-passed anterior-circulation studies with DWI-confirmed lesions. Digital Twin development cohort. See the evidence ↗
01 / THE NUMBERS
Compared with RAPID.
Evaluated in the Digital Twin
development cohort.
rCBF <30% · Approx. 95% CI 0.939–0.959
Tmax >6 s · Approx. 95% CI 0.919–0.950
Within a 2,793-study campaign
The headline CCCs describe 241 QC-passed anterior-circulation studies with DWI-confirmed lesions. CCC is Lin’s concordance correlation coefficient, a measure of agreement.
| Evaluation group | Studies | Core CCC | Hypoperfusion CCC |
|---|---|---|---|
| QC-passed anterior circulation, DWI lesion present | 241 | 0.950 | 0.936 |
| QC-passed, RAPID Tmax volumes >400 mL excluded | 1,554 | 0.928 | 0.932 |
| All RAPID-paired studies | 1,727 | 0.902 | 0.791 |
Hypoperfusion values use the confident display tier. Retrospective development-cohort evaluation, September 2026. RAPID is a comparator, not ground truth. These results do not establish external clinical validation or interchangeability with RAPID.
02 / THE RESULTS
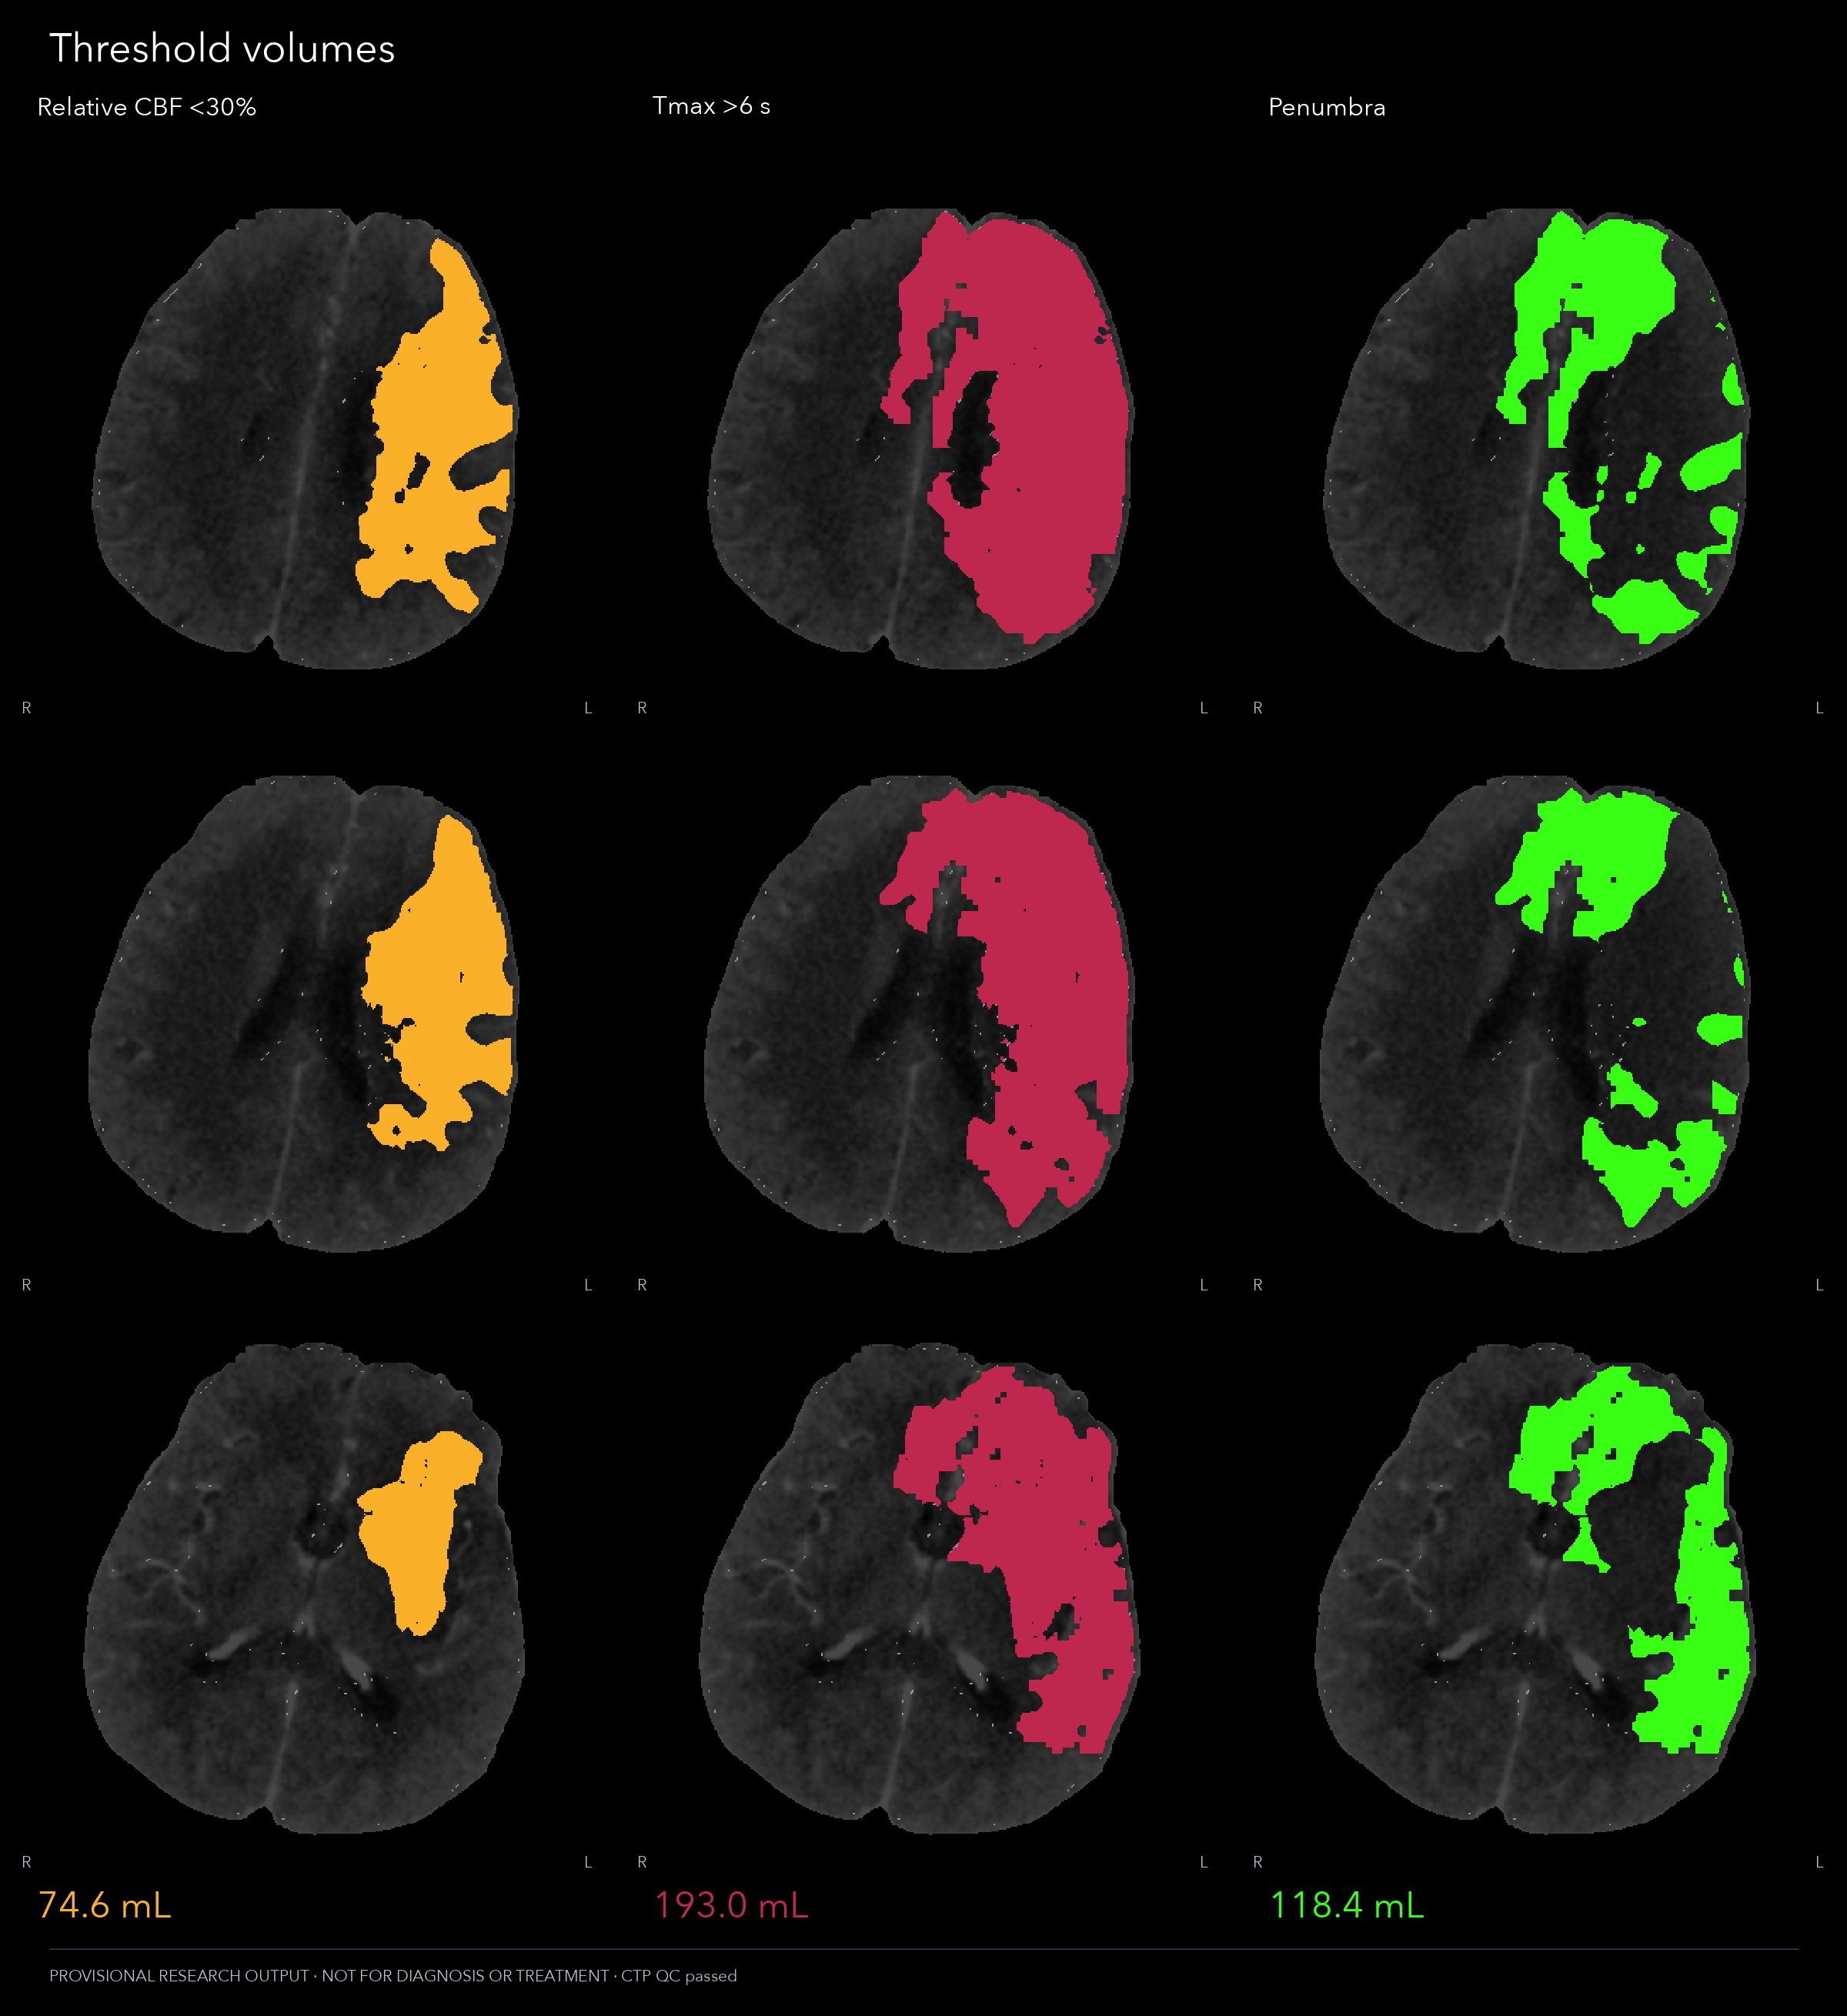
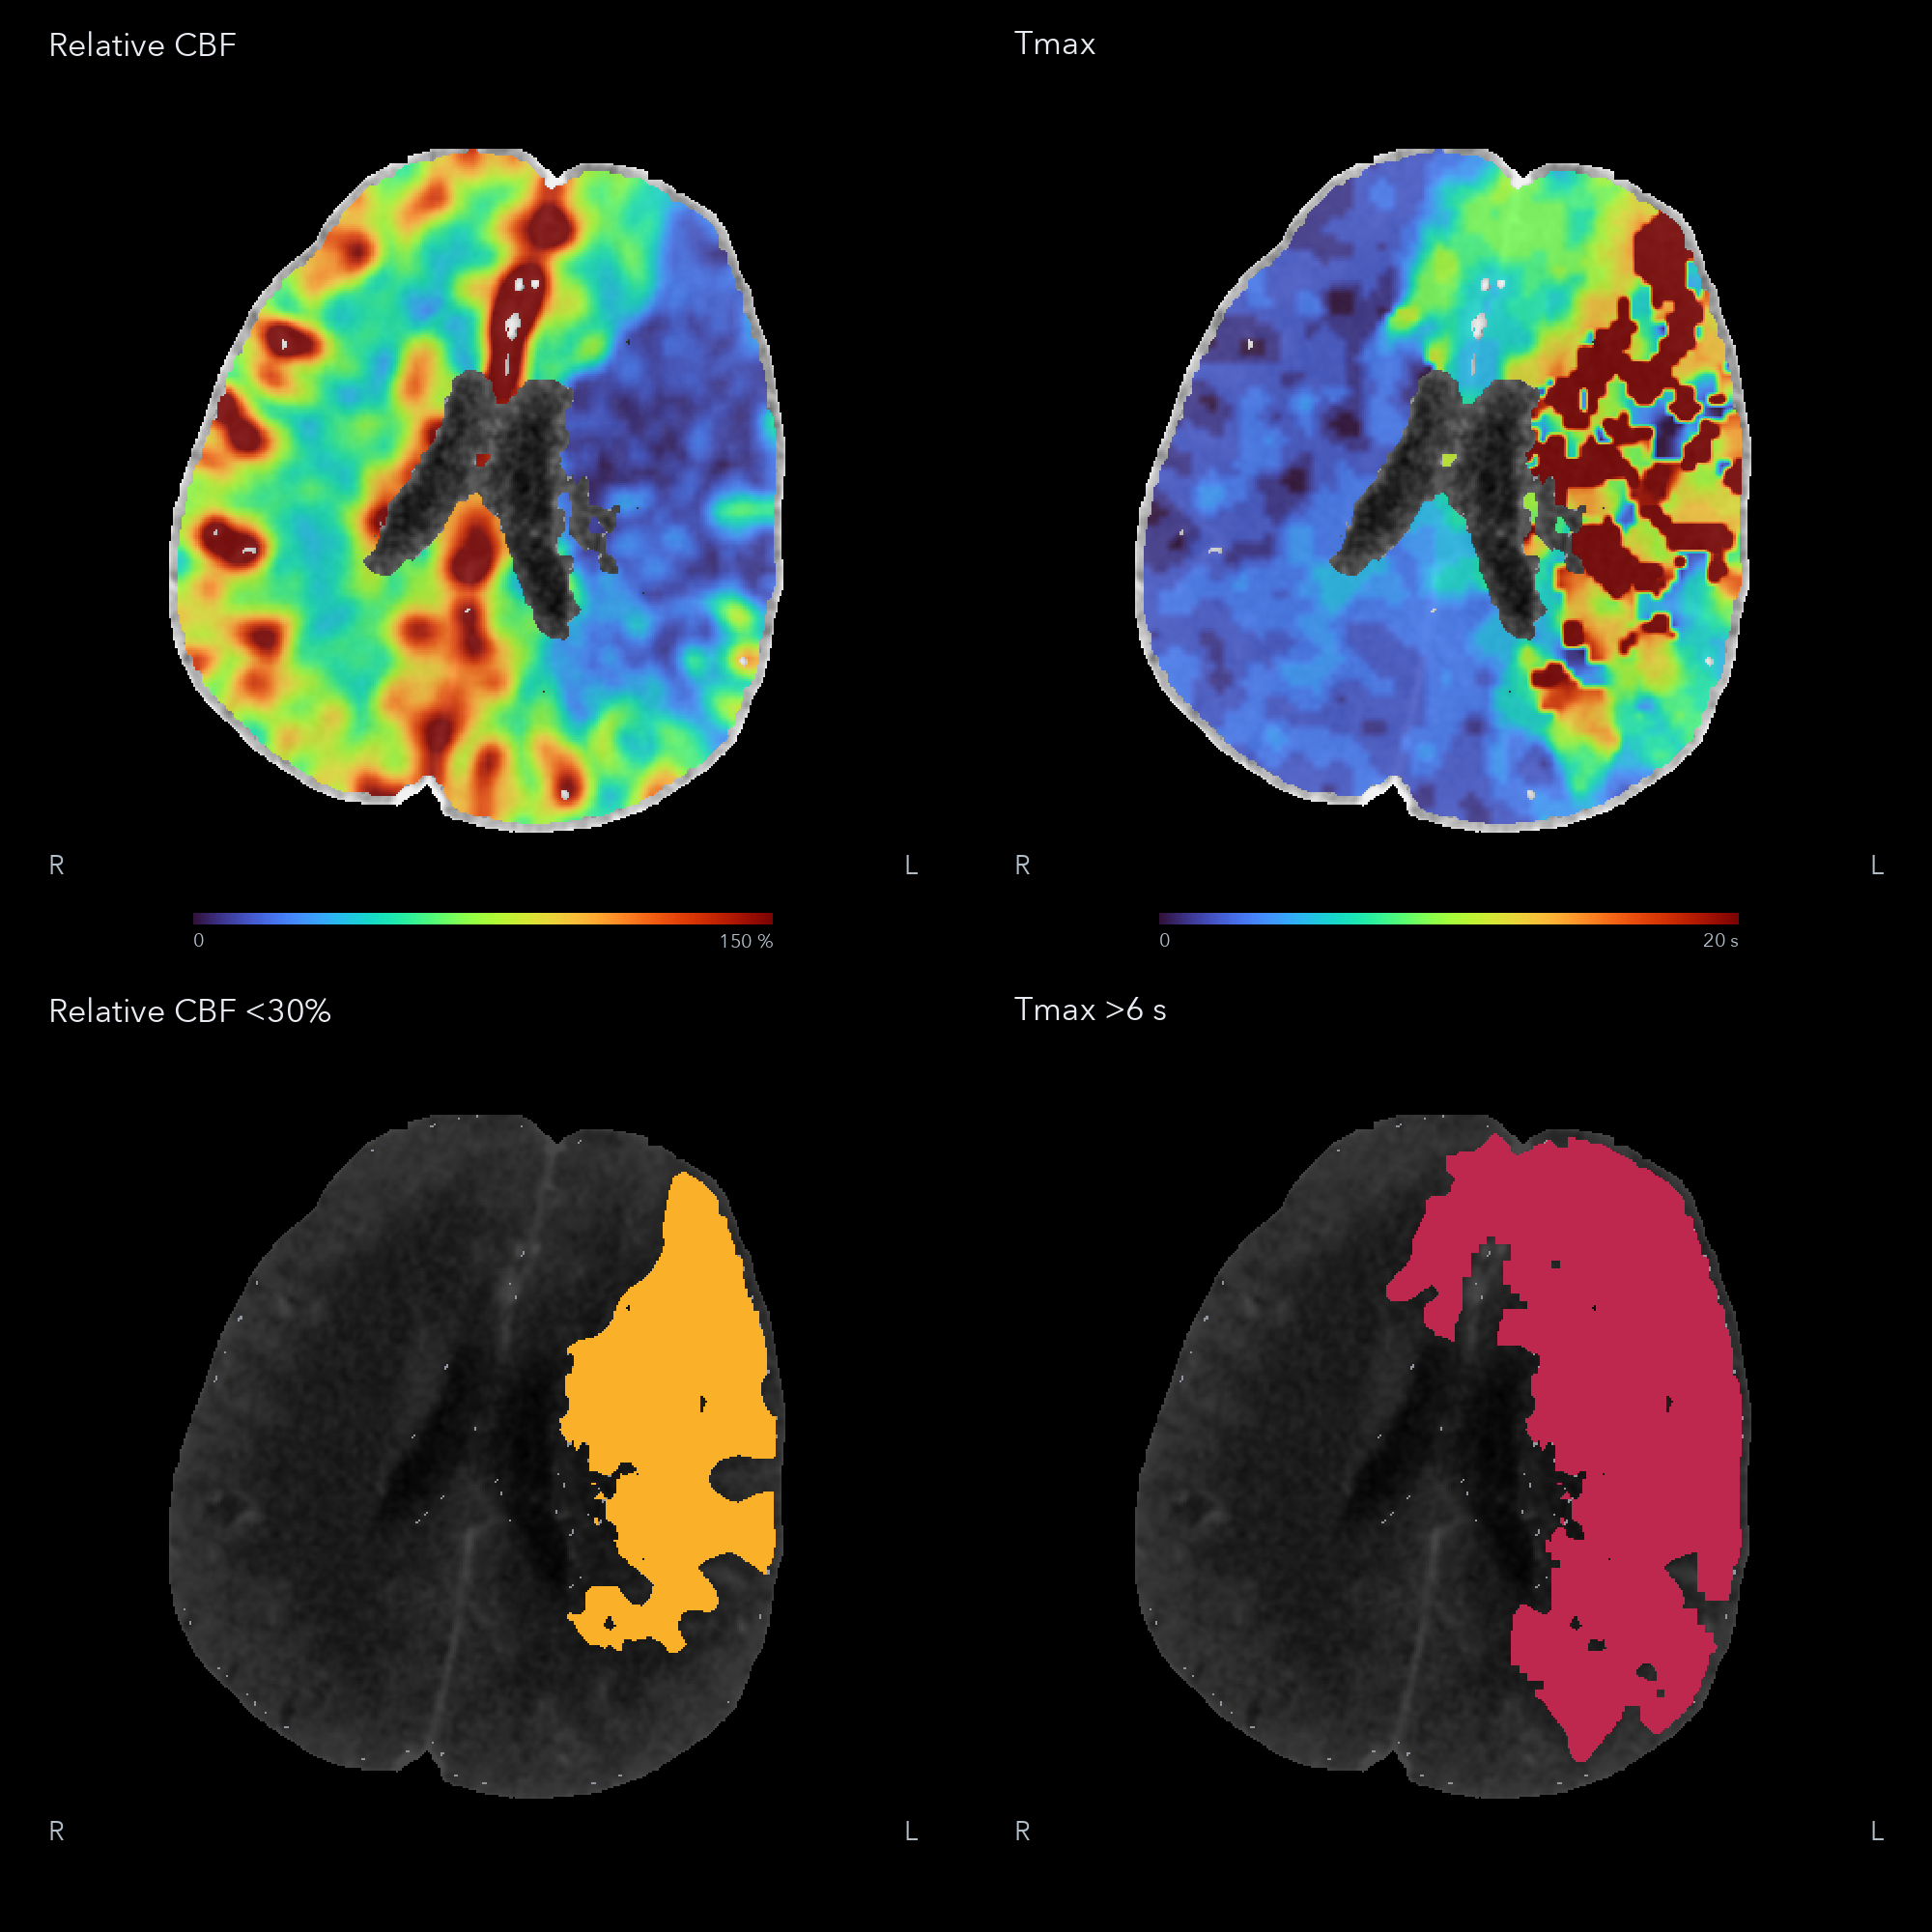
A real Digital Twin research example.
Large MCA-territory involvement.
Extensive perfusion mismatch.
The volumes that matter, alongside the images that give them meaning.
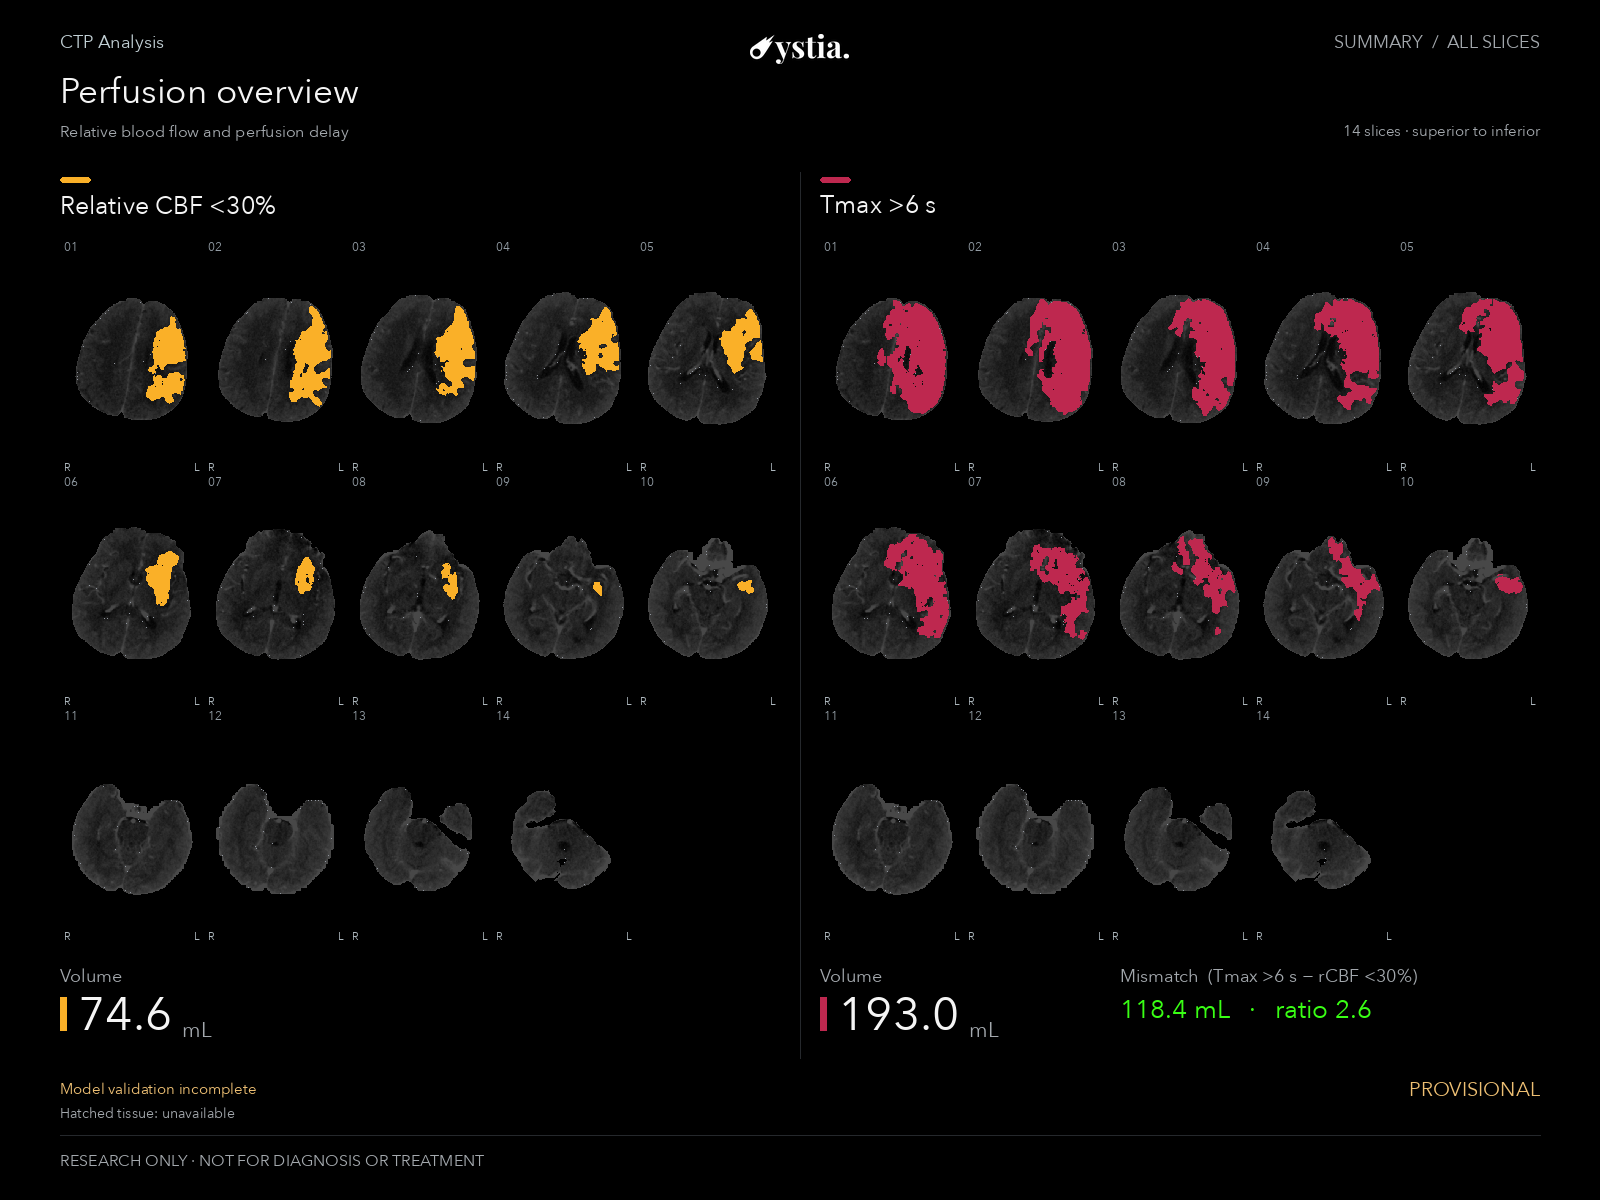
Relative blood flow, perfusion delay and mismatch.
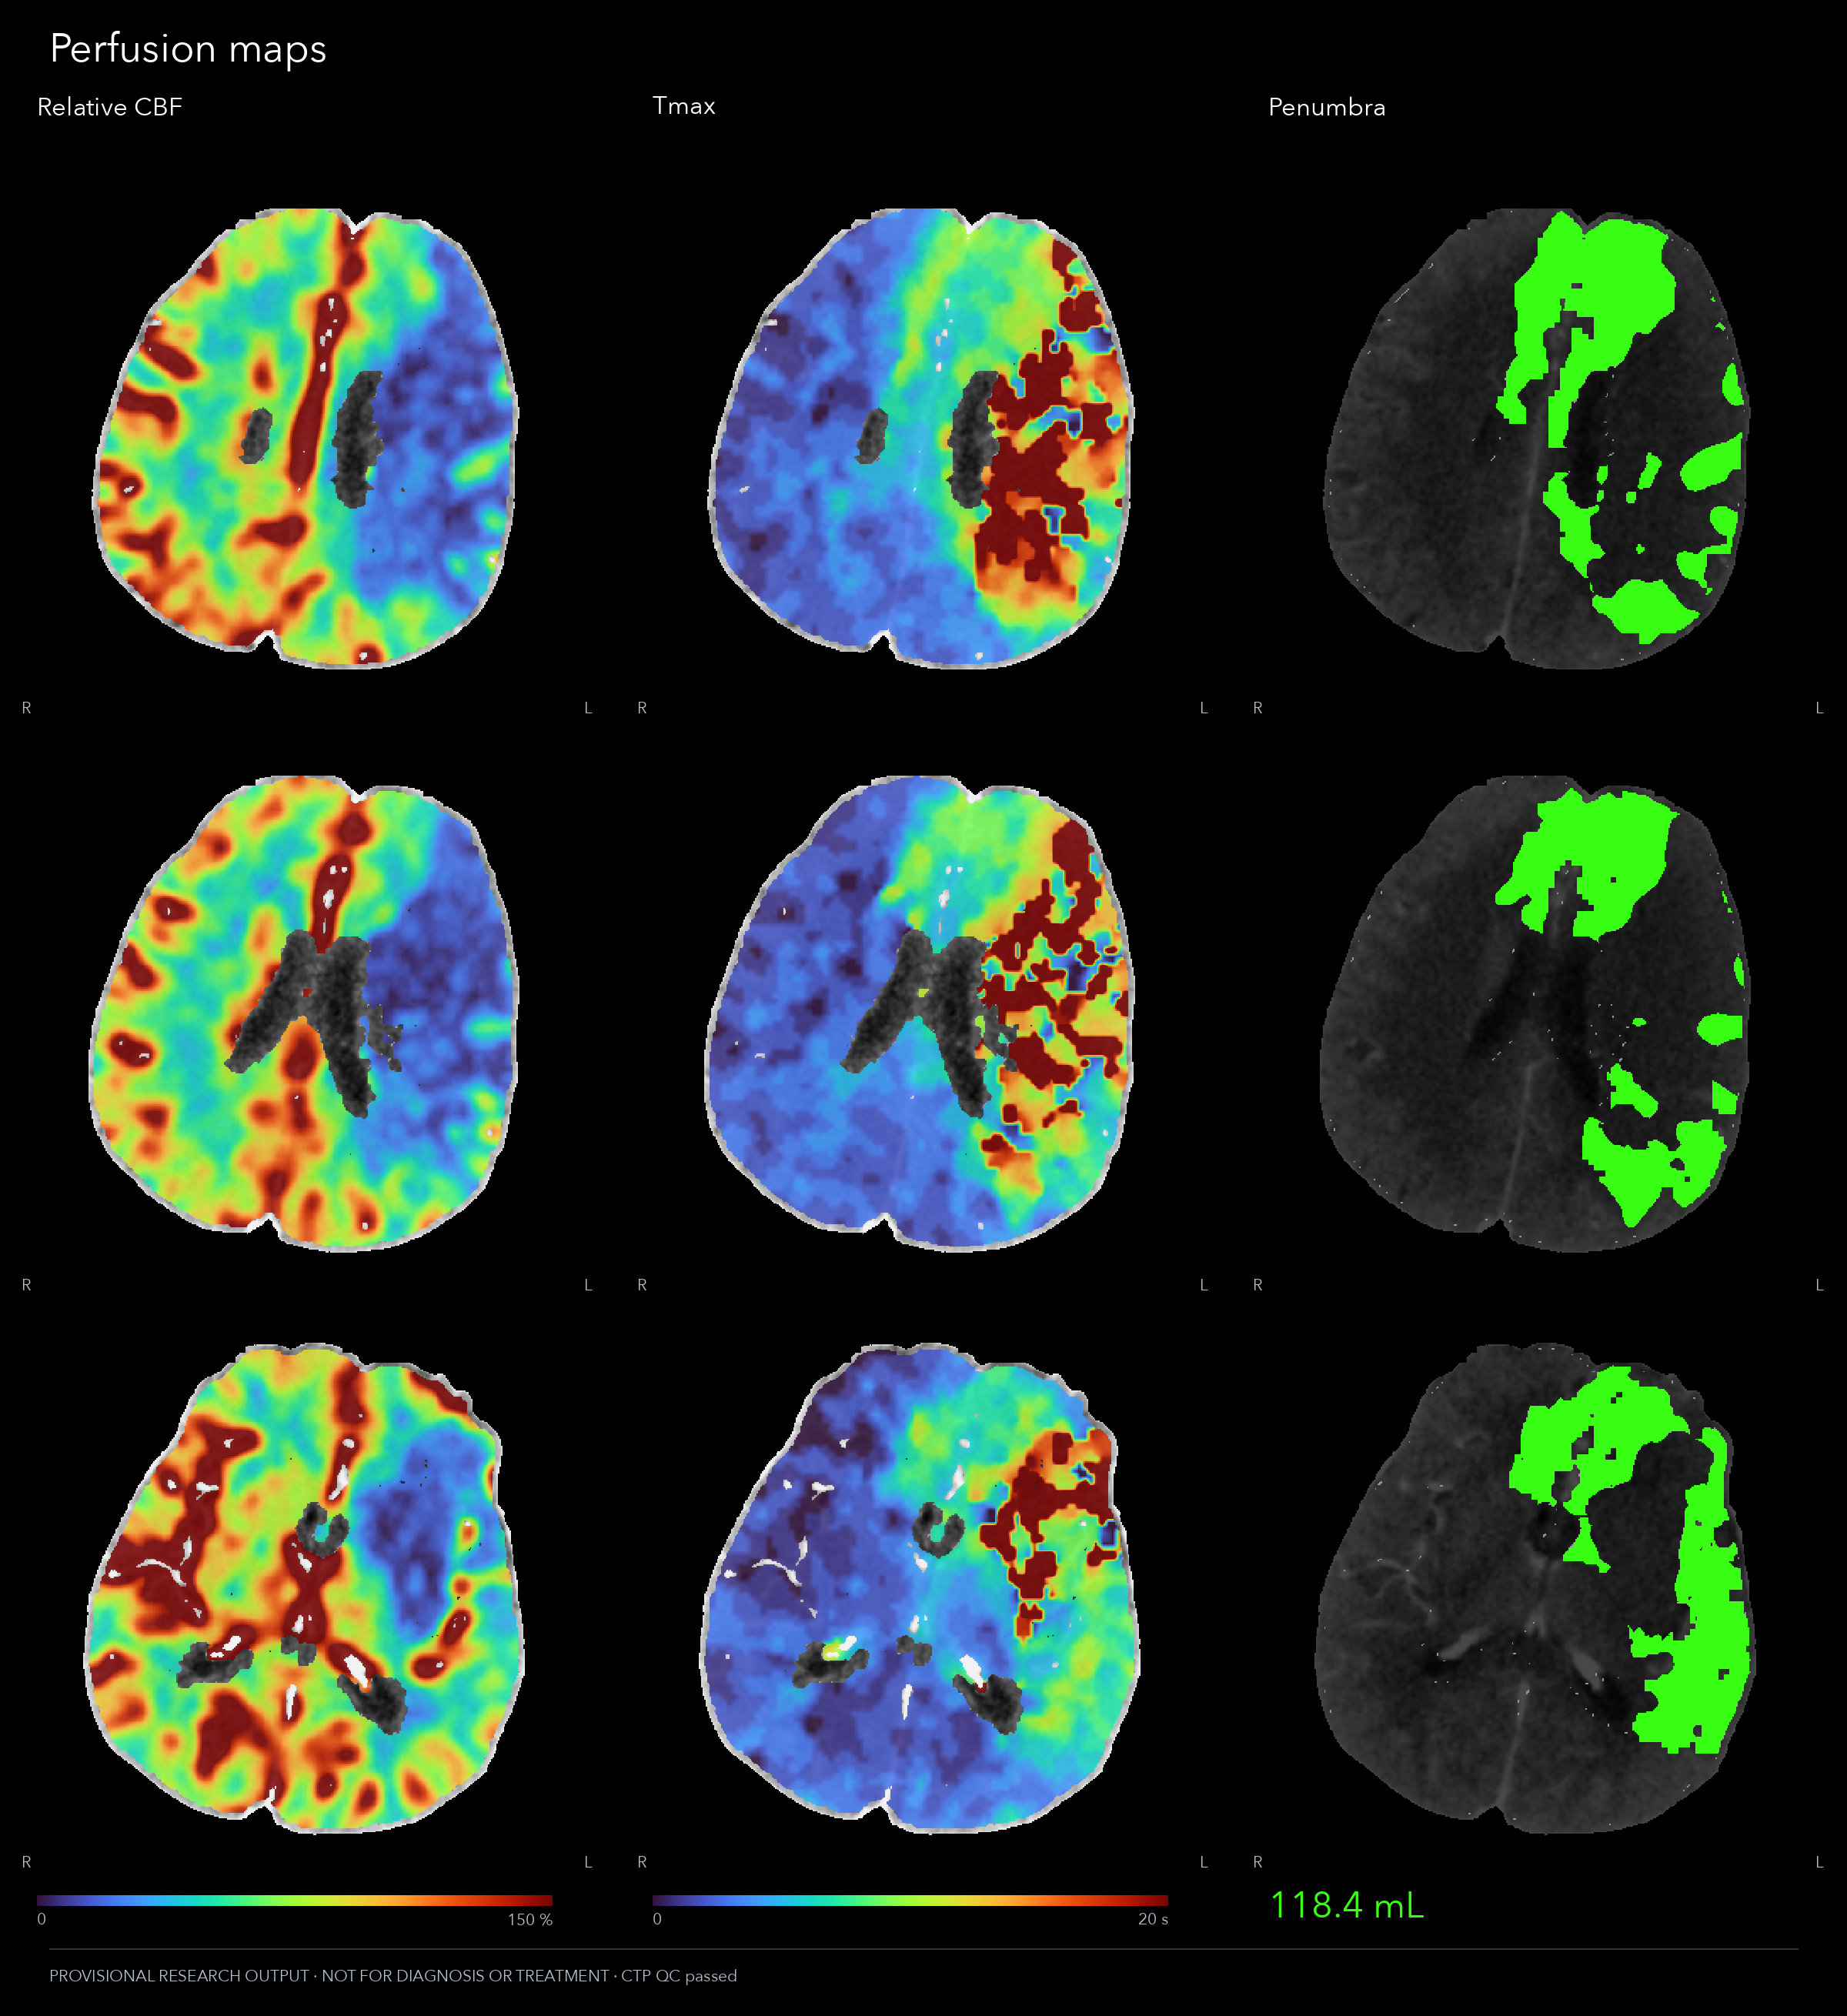 Open full resolution
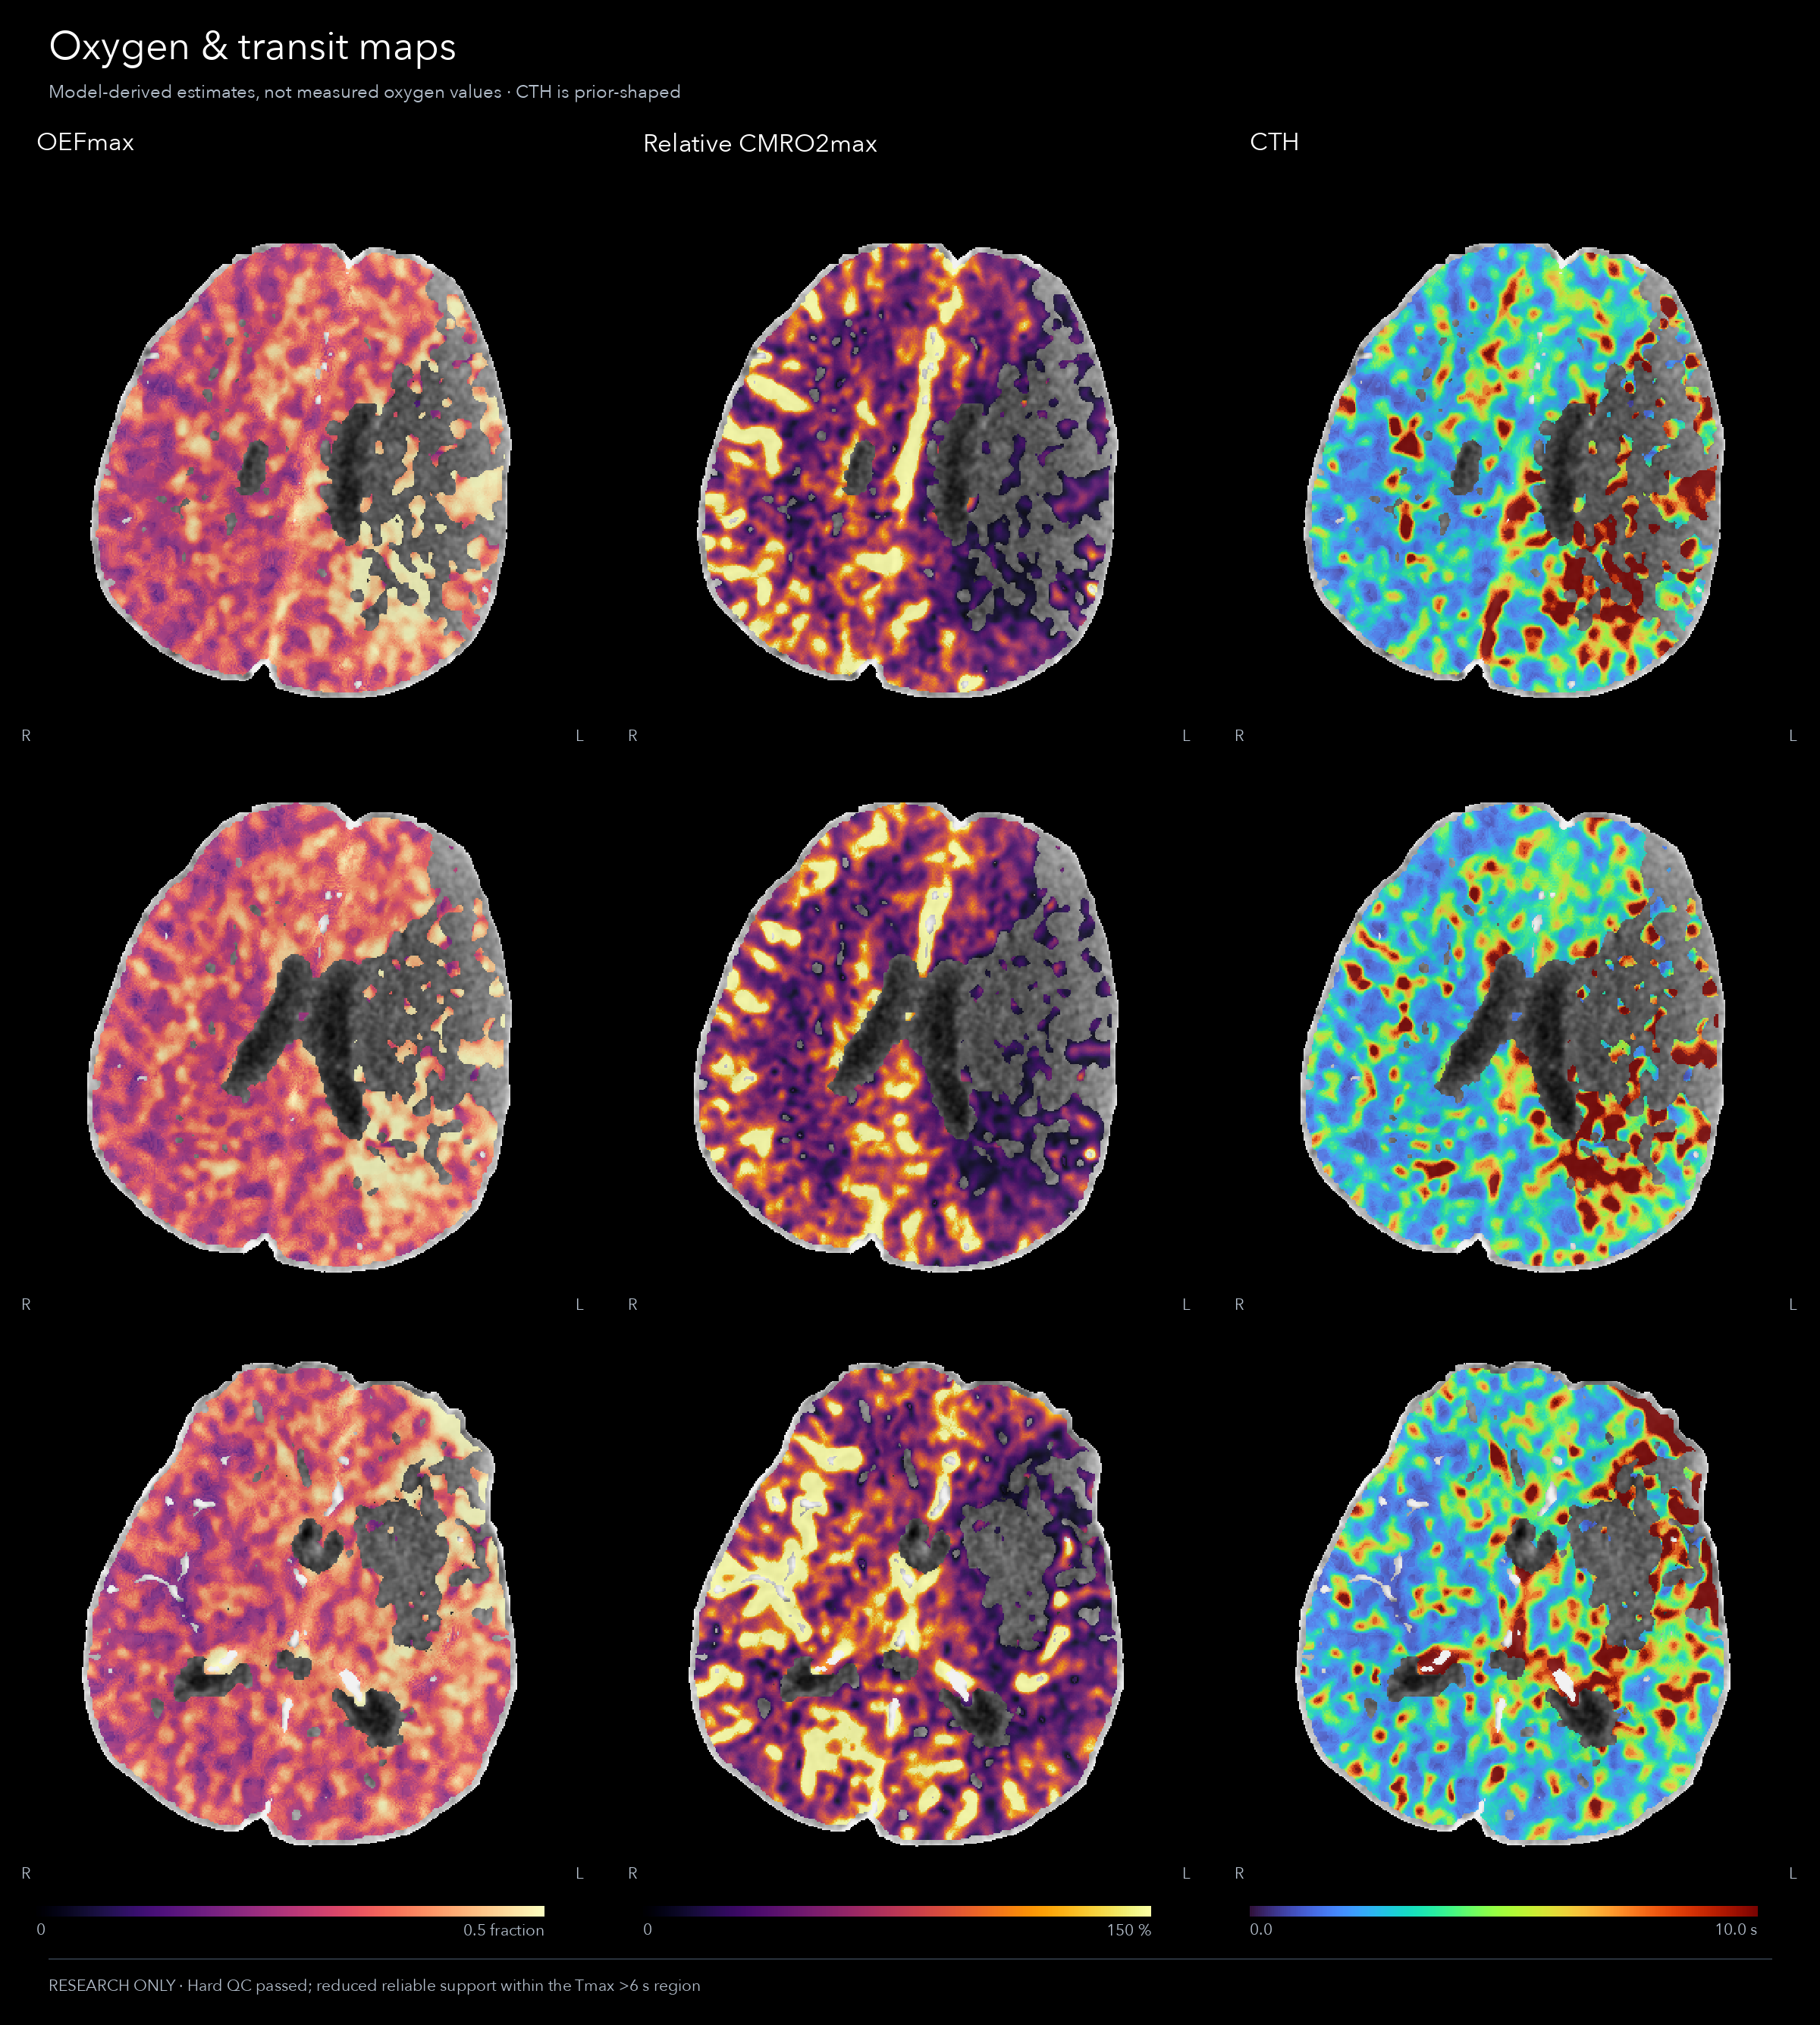
 Model-derived OEFmax, CMRO₂max and transit maps.
 Open full resolution
 Selected for illustration, not as an estimate of average performance. Source identifiers are removed. Oxygen and metabolism maps are model-derived research estimates, not measured oxygen values.
Core and hypoperfusion volumes, mismatch volume and mismatch ratio.
Summary views, threshold overlays, perfusion maps and oxygen-model maps.
Available images, processing progress and quality status in one place.
03 / THE EXPERIENCE
Your results travel with you. Review the numbers, open the images, and follow processing from your iPhone.
Illustrative iPhone UI with invented numbers.
The image is an anonymized research example.
Study access is limited to invited hospital members.
ILLUSTRATIVE DEMO
Today · 09:41
Explore sample images